
|

|
|
|
|
File size: 85015 Kb Date: 10/09/2015 Homepage Install support: Install and Uninstall OS: Win2000, WinXP, Win7 x32, Win7 x64, Windows 8, Windows 10, WinServer, WinOther, WinVista, WinVista x64 Requirements: Windows XP SP3 or higher Language: English | Hydrographic Survey Software or free Hydrographic Software and cheap Hydrographic Survey or the Bathymetry, good Seafloor Mapping Software or also Hydrographic Data Acquisition, Dredging Volume Calculation and Volume Calculations or free Bathymetric Software and cheap Single Beam Data Collection | Eye4Software Hydromagic 7.0.15.929 [Homepage] - by: Eye4Software B.V. - Download links for Eye4Software Hydromagic 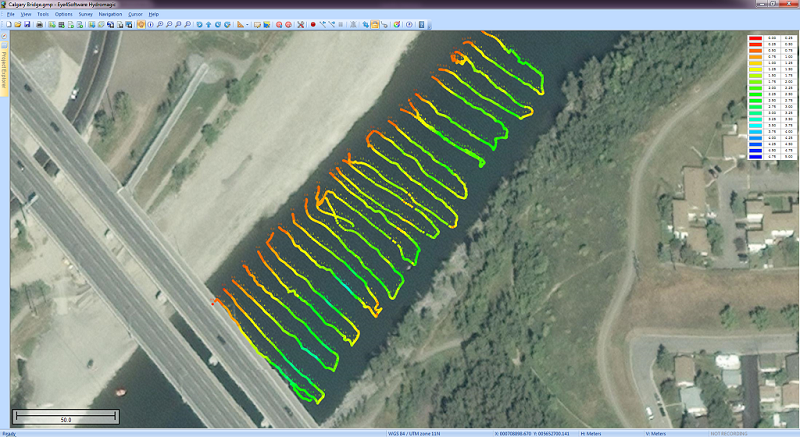 Click to enlarge Description: Eye4Software Hydromagic is hydrographic survey software for Windows. It can be used to generare depth maps using a GPS or RTK receiver and an echosounder or fishfinder. After recording the sounding, you can generate DTM's (Digital Terrain Models), depth contours, 3D views and cross-sections. It offers various methods of calculating volumes of bassins, ponds, river sections and lakes. The software is capable of reading and writing most popular CAD, GIS and nautical chart formats, including: GeoTIFF, Microstation DGN, ARC/INFO, MapInfo MIF/MID, AutoCad DXF files, IHO S57/S63 Electronic Natutical Charts, Google Earth KML/KMZ files and ESRI shapefiles. A wide range of map projections is build in. More then 5000 map projections are built in. In addition, NTv2, NADCON and HARN correction grids are supported. The software is also able to calculate tide levels in real time by using a RTK receiver connected to the PC. Using the antenna height, antenna offset and a geoid model, the tide level is calculated and applied to the sounding, resulting in a height values relative to the local vertical datum. When no map is available for your area, you can use the build-in map downloading tool. Use OpenStreetMap, Google Maps or Bing maps as background maps. Since this latest version, the software can be used to collect and process dual frequency sounding data, as well as additional sensor data, such as magnetometer data, or advanced data from echosounders, like reflectivity or bottom-loss. Another big improvement is the use of shorelines. Shorelines can be used to add data collected near the shore, to create islands or to clip your DTM data, by just by specifying on which side of the shoreline the water is. For the people who want to perform their survey by using planned lines, there is also good news: It is now possible to calculate a DTM or depth contours from multiple soundings or shorelines. Just press a single key to start a new line ! Recent changes in this Major Update: Remarks - Comments - Reviews (Add your opinion about this program) |
See also in Home and Education: Geometry and Mathematic Analysis
|
|


 Download: